Keeping an Eye on My Home Network
• Home Lab
Lately I’ve been paying a little more attention to what’s happening on my home network.
My kids have a lot of cousins and friends who come over, and naturally they all bring devices with them. Laptops, tablets, handheld consoles, whatever they’re playing games on that week. The problem is that some of those machines are in pretty questionable shape. Kids download mods, game launchers, random software, and sometimes things that definitely shouldn’t be installed.
More than once I’ve had the feeling that a device might already be compromised before it even connects to the Wi-Fi.
A while back one of my nephews mentioned his account had been hacked. That got me thinking: was it just an email password problem, or could his computer have malware on it that might start talking to the network once it connects? I realized I didn’t really have a good way to answer that question.
The Router UI Isn’t Very Helpful
My internet connection uses an AT&T BGW320 gateway. It works fine as a router, but the admin interface is painfully slow. Pages can take 30 seconds or more to load, and sometimes they just fail entirely.
Even when a page finally loads, the information isn’t very useful. It’s mostly raw counters and tables. There’s no history, no graphs, and no easy way to compare what’s happening now with what happened earlier.
If I want to know whether a device suddenly started sending a lot of traffic, or whether something was active in the middle of the night, the router UI doesn’t really help.
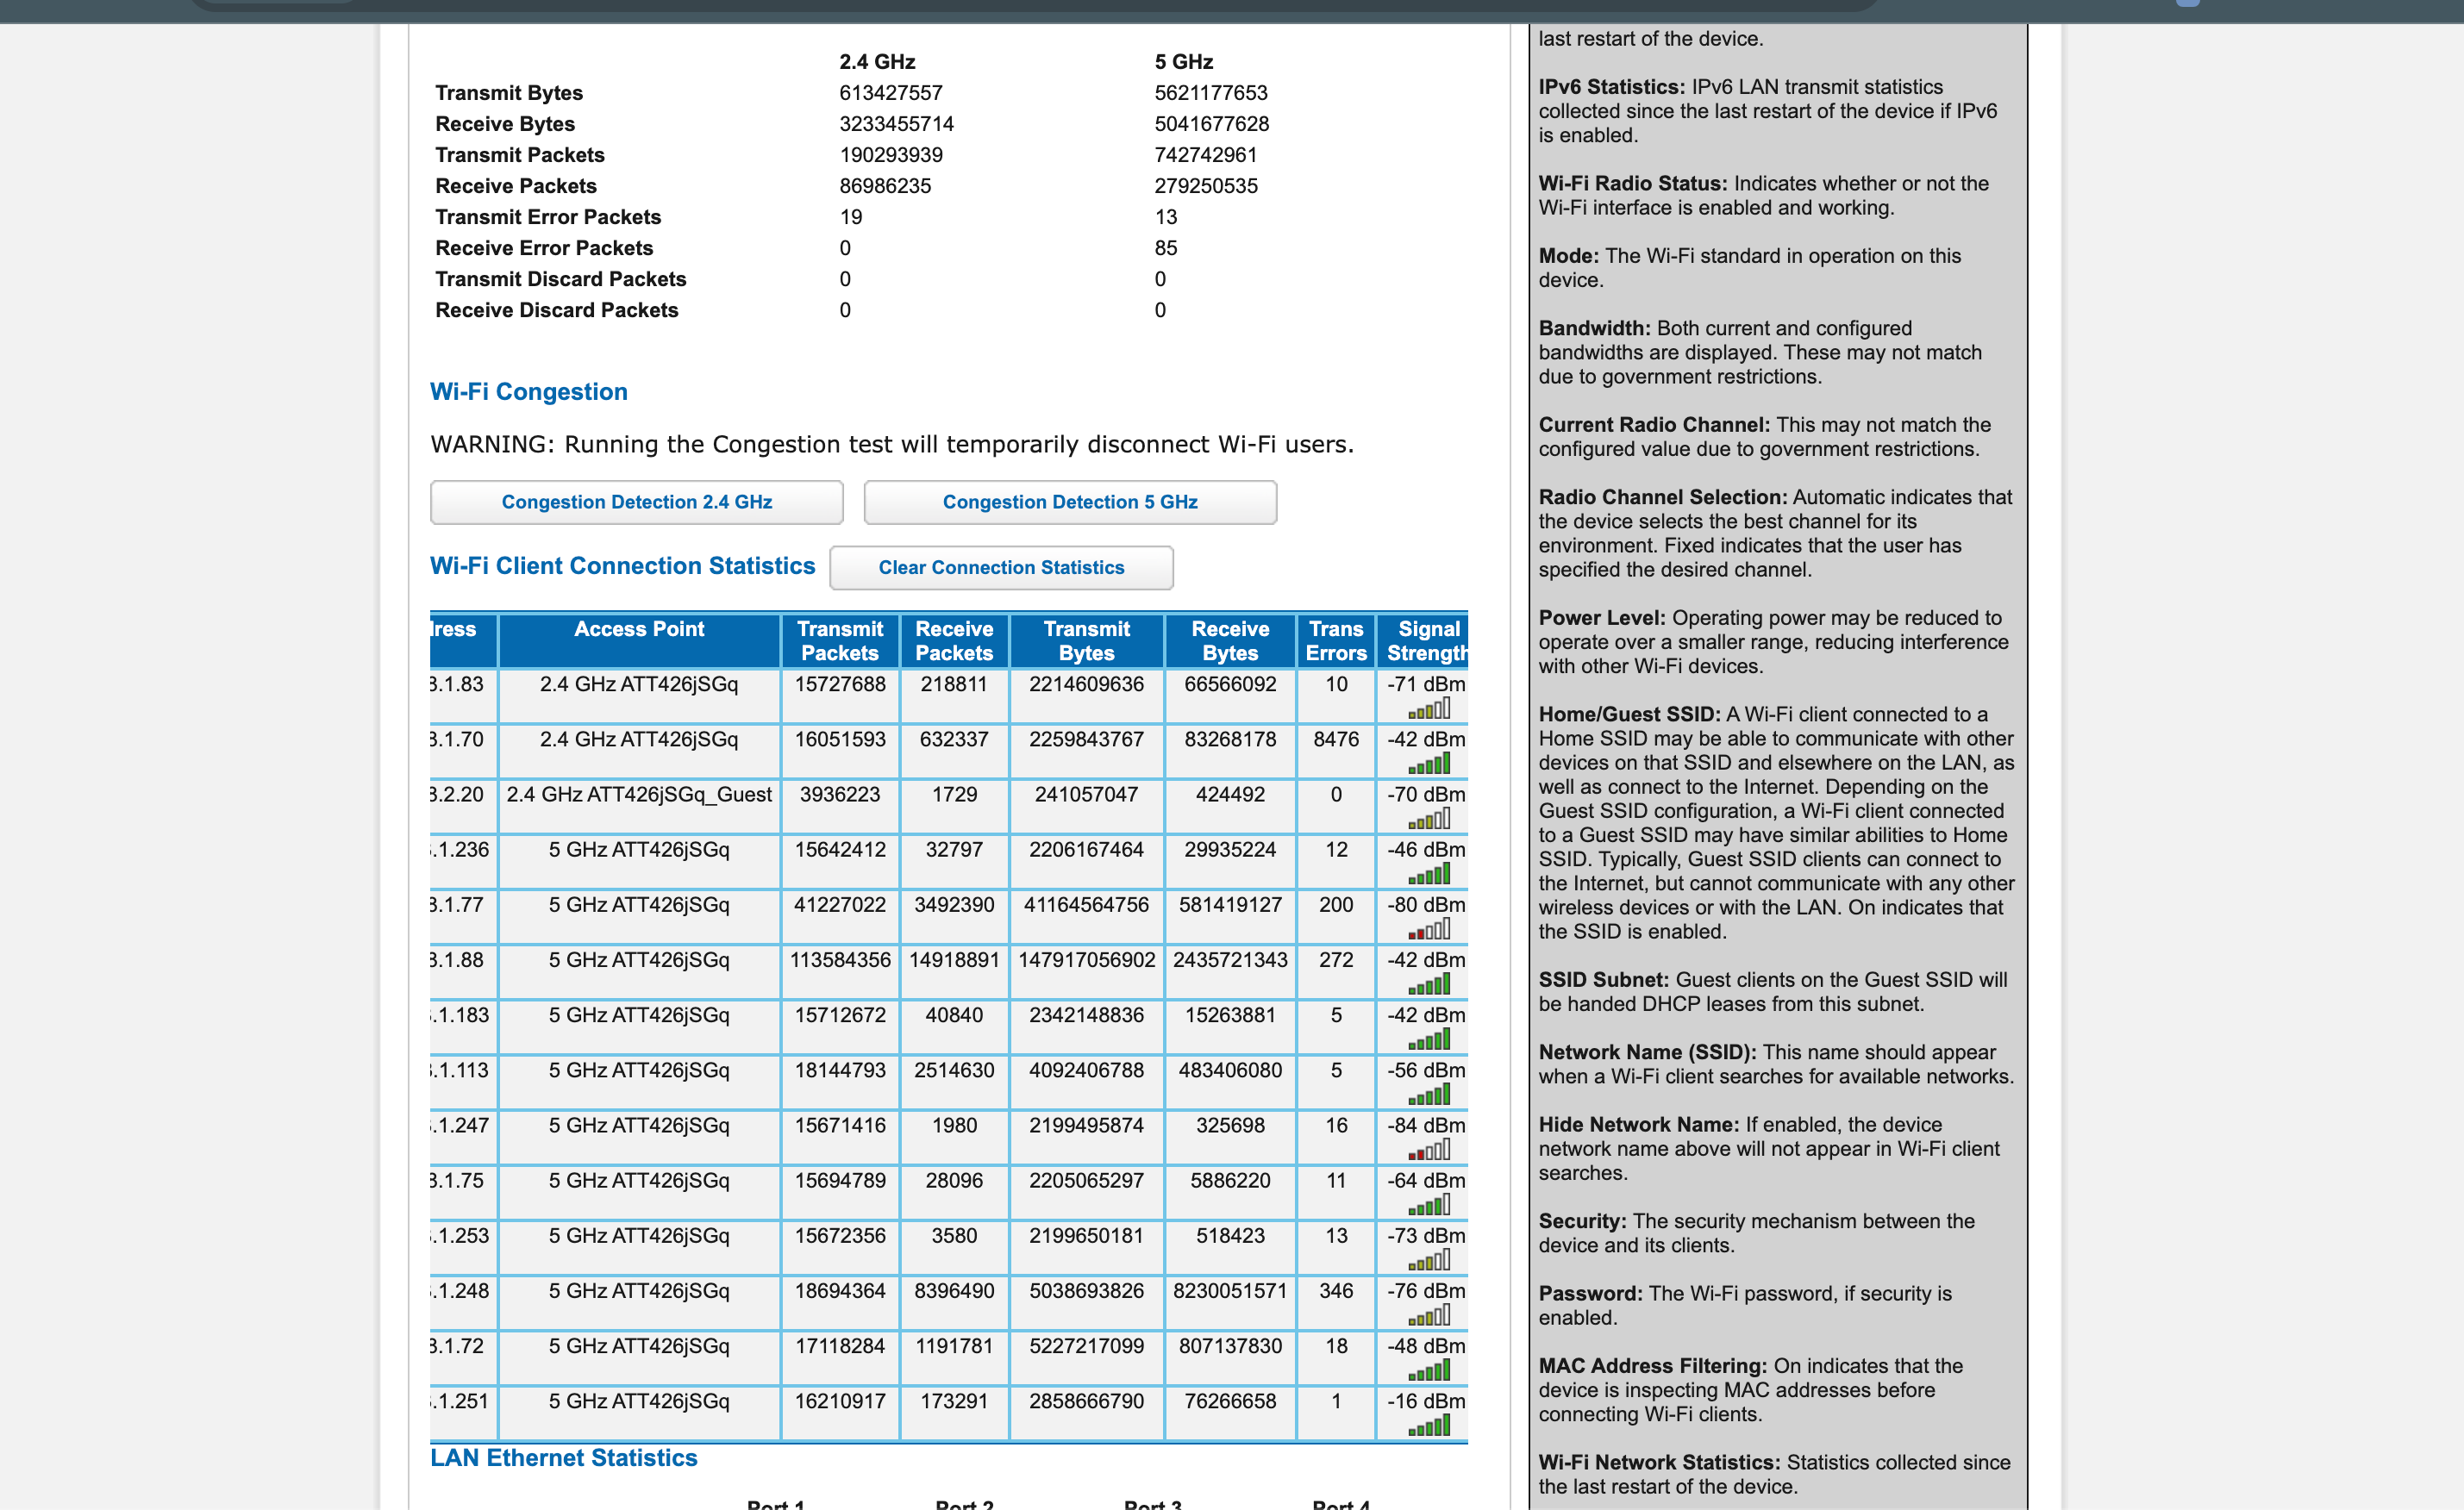 The BGW320 interface works, but it’s slow and not great for quick analysis.
Pulling the Data Directly
Instead of clicking through the router interface, I wrote a small Node.js script that just pulls the data directly from the router’s status page.
The page contains a large HTML table listing connected devices and various statistics about them. The script downloads that page and parses the table into structured data.
At the core it’s just a simple HTTP request:
import axios from "axios";

const SOURCE_URL = "http://192.168.1.254/cgi-bin/lanstatistics.ha";

export async function fetchDevicesPage(): Promise<string> {
  const response = await axios.get<string>(SOURCE_URL, {
    timeout: 30000,
    headers: {
      "User-Agent": "bgw320-network-monitor/0.1.0",
      Accept: "text/html,application/xhtml+xml"
    }
  });

  return response.data;
}
Once the page is downloaded, the script walks through the device table and converts each row into a normal JavaScript object.
export function parseDevices(html: string): Device[] {
  const $ = cheerio.load(html);
  const rows = $("table.grid tr").toArray();
  const devices: Device[] = [];

  for (const row of rows.slice(1)) {
    const cells = $(row)
      .find("td")
      .toArray()
      .map((cell) => $(cell).text().replace(/\s+/g, " ").trim());

    if (cells.length < 12) continue;

    const mac = normalizeMac(cells[0]);
    if (!mac) continue;

    devices.push({
      mac,
      ip: cells[2] || undefined,
      accessPoint: cells[3] || undefined,
      txBytes: toNumber(cells[6]),
      rxBytes: toNumber(cells[7]),
      signal: cells[9] || undefined
    });
  }

  return devices;
}
Running the script produces a snapshot of what the router currently sees:
{
  "timestamp": "2026-03-05T01:35:47.396Z",
  "deviceCount": 15,
  "devices": [
    {
      "mac": "74:38:B7:0A:90:51",
      "ip": "192.168.1.83",
      "txBytes": 2179966541,
      "rxBytes": 49142396,
      "signal": "-70 dBm"
    }
  ]
}
I packaged the script as a small CLI so it can be run quickly when needed:
npx bgw320-network-monitor
Turning Snapshots Into History
A single snapshot is interesting, but what really matters is how things change over time.
So I set up a small Node.js job that runs the collector every five minutes and stores the results in a SQLite database. Each run just inserts another snapshot.
Once you have a few hours or days of data, you can start answering questions that the router UI can’t:
- Which devices are consistently using the most bandwidth?
- When do traffic spikes happen?
- Are any devices active when nobody should be using them?
A Small Dashboard
After that I put together a simple Next.js dashboard to visualize the data.
It’s nothing fancy, just a few charts that make the patterns easier to see:
- Line charts for comparing device traffic over time
- Bar charts showing the biggest bandwidth users
- A heatmap showing when devices are active during the day
The heatmap ended up being the most useful. It makes it very obvious if a device is doing something in the middle of the night when nobody in the house should be using it.
That doesn’t automatically mean malware, of course. But it’s a good signal that something might be worth investigating.
What I’m Actually Watching For
This isn’t meant to be some enterprise monitoring system. It’s just a way to keep an eye on what’s happening on my own network.
Mostly I’m looking for things like:
- Devices that suddenly start sending a lot of traffic
- Machines that stay active long after everyone goes to bed
- Anything that behaves differently from its usual pattern
If one of the kids’ friends brings over a laptop that starts hammering the network all night, at least I’ll be able to see it.
Next Steps
Right now the system just collects data and shows trends.
The next things I want to experiment with are:
- simple alerts when traffic patterns look unusual
- a way to quickly kick a device off the network if something looks suspicious
- running the dashboard on a small Raspberry Pi so it can stay up all the time
Nothing too complicated. Just a small project to make my home network a little less of a mystery.