Graphing Frontend ASTs in Neo4j
• Frontend, Neo4j
Frontend code is full of relationships—components render others, handlers emit events, stores pass along state. Those links are obvious when you are deep in the code, but hard to see across the project as a whole. Turning the source into a graph helps make those connections visible.
Why bother
Tracing a single behavior across files—like how a click becomes an API call—often means opening half a dozen files and mentally reconstructing the flow. That process does not scale. Representing the project as a graph makes it easier to reason about interactions, dependencies, and event flows without losing context.
Parsing and export
I started with a small tree-sitter script that walks each file's AST and emits a few basic facts:
- rendered components
- emitted and listened events
- composable calls
- store reads and writes
- import edges
The script writes Cypher that can be imported into Neo4j. It is quick to rerun and updates existing nodes using MERGE, so the data stays current as the repo evolves.
The parser is far from perfect. It misses deeper call chains and sometimes flattens context it should not. In hindsight, using ANTLR or a more complete parser would have been the right move—but this version was enough to explore the idea and learn what questions a better pass should answer.
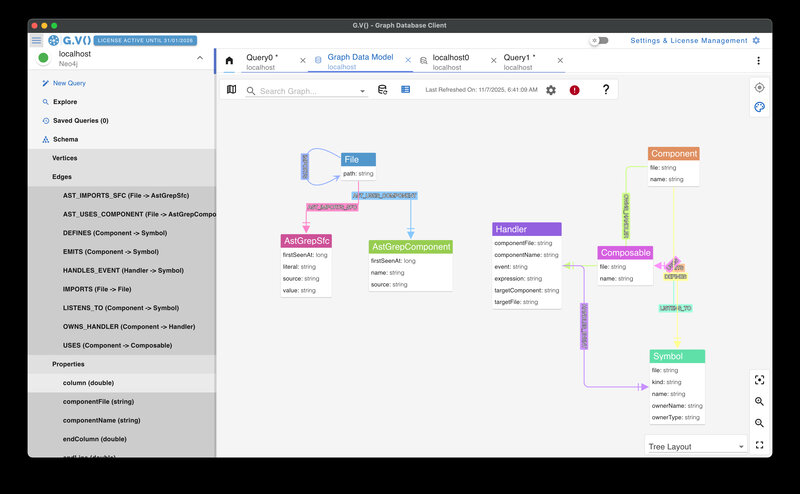
The data model
The current schema uses a few node types—File, Component, Composable, Store, Handler, and Symbol—and relationships like IMPORTS, RENDERS, USES, READS_FROM, WRITES_TO, EMITS, and LISTENS_TO.
It is not comprehensive or elegant, just what the parser happens to extract. But even this limited snapshot captures useful structure: how components depend on one another, which events remain active, and where coupling accumulates.
Querying behavior
Once the data is loaded, Cypher queries surface insights quickly:
- Which handlers still listen for deprecated events?
- Which components wrap a network helper instead of calling it directly?
- Which files have the most imports?
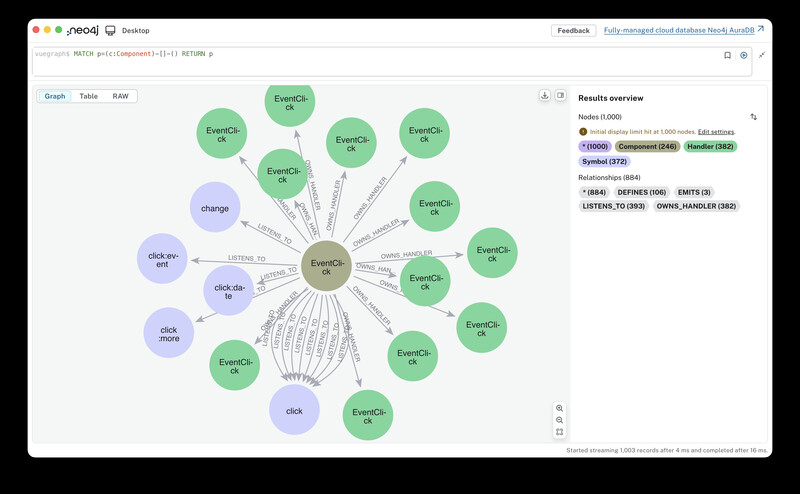
Even basic questions like these highlight problem areas faster than text search or IDE navigation. You start seeing the system as interconnected behavior instead of scattered files.
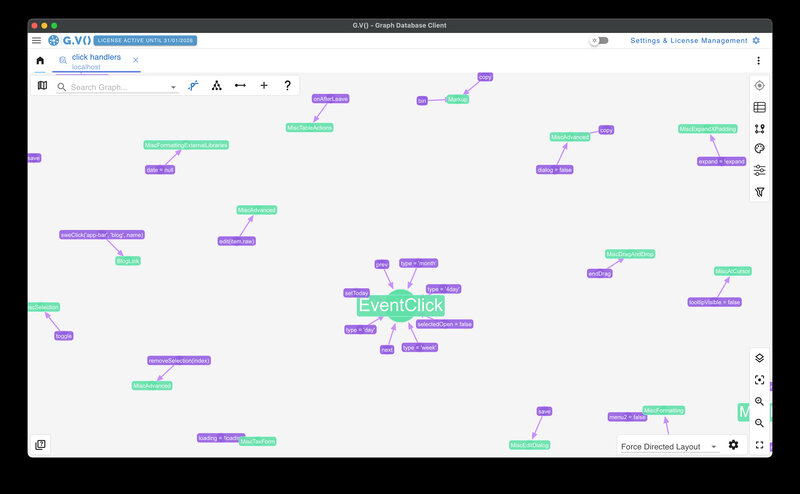
MATCH p=()-[:LISTENS_TO]->() RETURN p highlights how many handlers still reference older event names.Because each node carries metadata (file paths, composable names, or hints from the AST), the answers come back in plain language instead of raw syntax trees.
Lessons so far
The experiment proved the value of visualizing code relationships, even with an incomplete parser. The graph helps spot stale event names, redundant handlers, and overly complex dependencies. It is not production tooling, but it makes architectural reasoning more concrete.

Neo4j Desktop shows the same structure, but its default labels slow me down because I cannot rename nodes without extra scripting. G.V() keeps the data identical while letting me reword nodes on the fly, so I can skim behavior instead of raw symbol names.

The next version will likely switch to ANTLR, capture function calls, and enrich relationships with source positions and line context. Each improvement should make the graph less about syntax and more about actual behavior.